New Products on Waro | April 2024
Benjamin THOMAS
April 29, 2025


In January, we launched the new Waro analysis dashboard analysis dashboard: an essential new tool for transforming your impact data into concrete action levers, and facilitating the management of your decarbonization objectives.
This first launch marked a turning point, enabling you to centralize the analysis of all your environmental KPIs and create customized visualizations.
Today, we're proud to present an enriched version of the dashboard, designed to take analysis even further, and help you move from strategy to action.
Thanks to new areas of analysis and improved visibility of your impacts, this update transforms the dashboard into a genuine CSR management cockpit, designed to meet the strategic and operational needs of your CSR, Product and Purchasing teams.
You can now view your environmental impact by product life-cycle stage: raw materials, production, transport, use, end-of-life...
➡️ Why it's useful: This analysis gives you a clear, structured view of the most important emissions items, enabling you to prioritize your reduction actions where they will have the greatest impact.

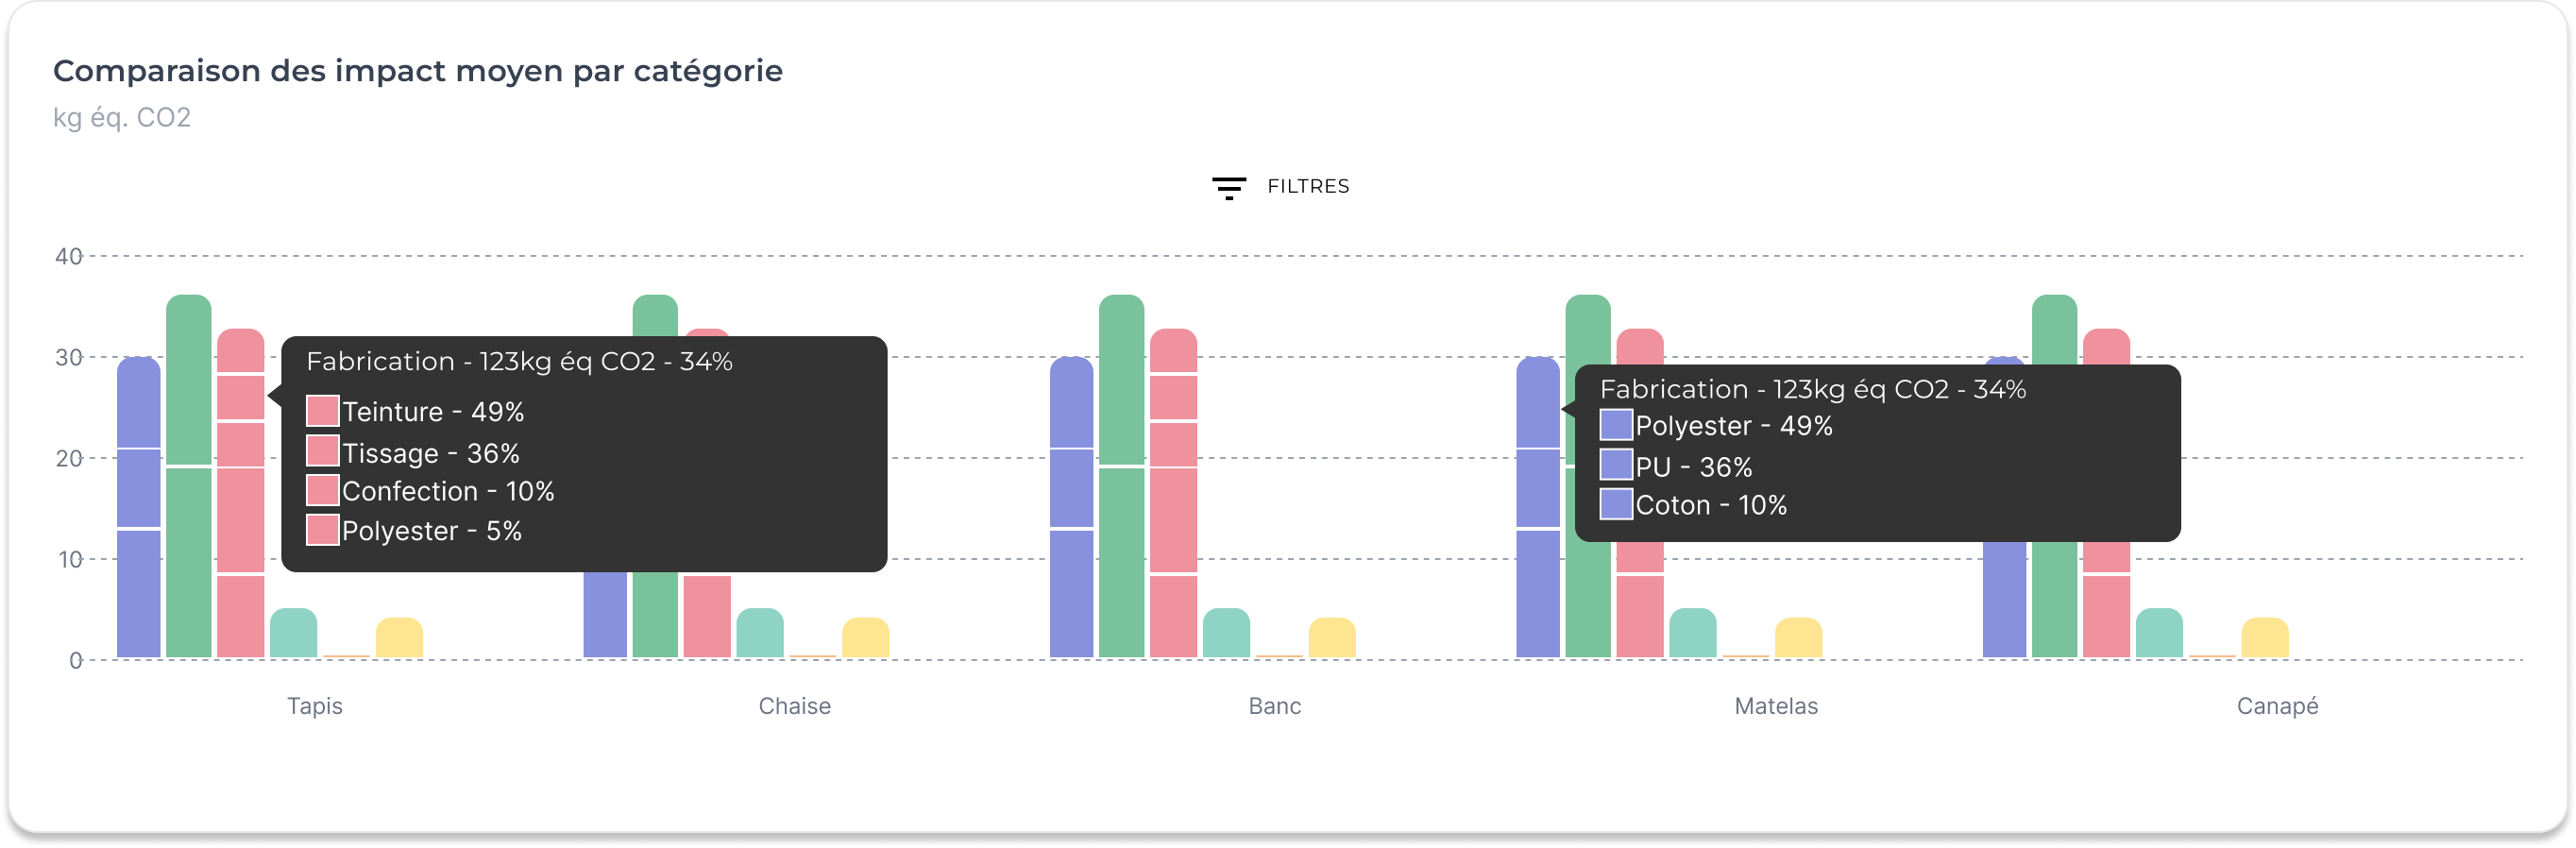
A new area of analysis is now available: processes and materials. You can compare the environmental impact of the processes and materials used in the manufacture of your products.
➡️ Why it's useful: This granularity helps you trace emissions back to their source, detect the most emissive processes, compare sourcing options, or support your product eco-design approach.
In addition to gross impact, the dashboard now allows you to track your emissions in terms of carbon intensity (kg.eqCO2/€): a key indicator used by many brands to relate their emissions to the economic value created.
➡️ Why it's useful: Carbon intensity enables you to manage your impact reduction strategy independently of your economic growth. It facilitates the monitoring of a trajectory aligned with benchmarks such as SBTi, and enables you to anticipate extra-financial reporting obligations (CSRD, CSDD...).

Waro's dashboard becomes a veritable hub for analyzing and managing your environmental impact, designed to meet the specific needs of each team:
All these new features enhance your dashboard, while retaining its simplicity of use. You can still :


.png)
.png)

