New: Assess the impact of your products in the market

Benjamin Thomas
September 30, 2026

.png)
%201.png)
Since the launch of the textile environmental labeling system, many brands have been reporting their products’ scores on the government portal. Starting October 1, any third party will also be able to submit scores for products that brands have not reported. As a result, the scores for a large portion of the market will become public and comparable.
For brands, this deadline raises several questions: “Are my products’ scores good?”, “Where should I focus my eco-design efforts?”, “Which products should I highlight?”
In this context, simply knowing their scores is no longer enough; brands must be able to assess how they measure up against the market.
To address these new challenges, WARO now includes a benchmark of all environmental costs in the market, based on public data from the reporting portal.
Each product is compared to other products in its category.
This analysis allows you to
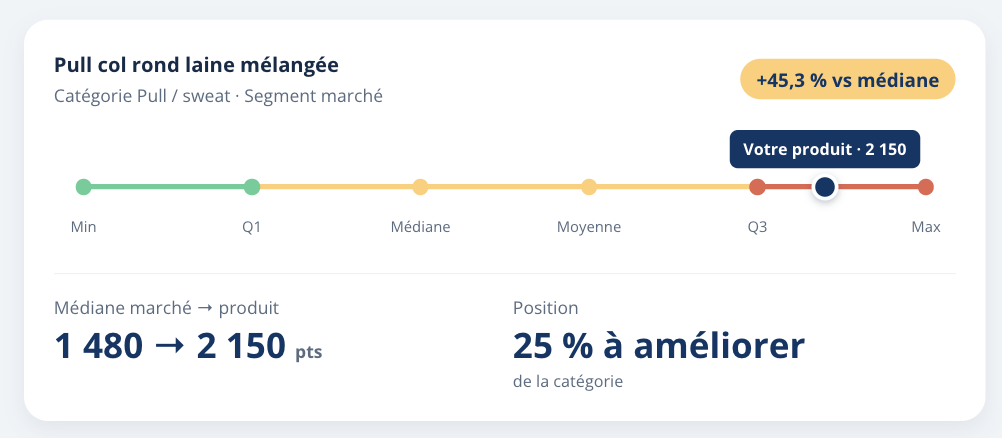
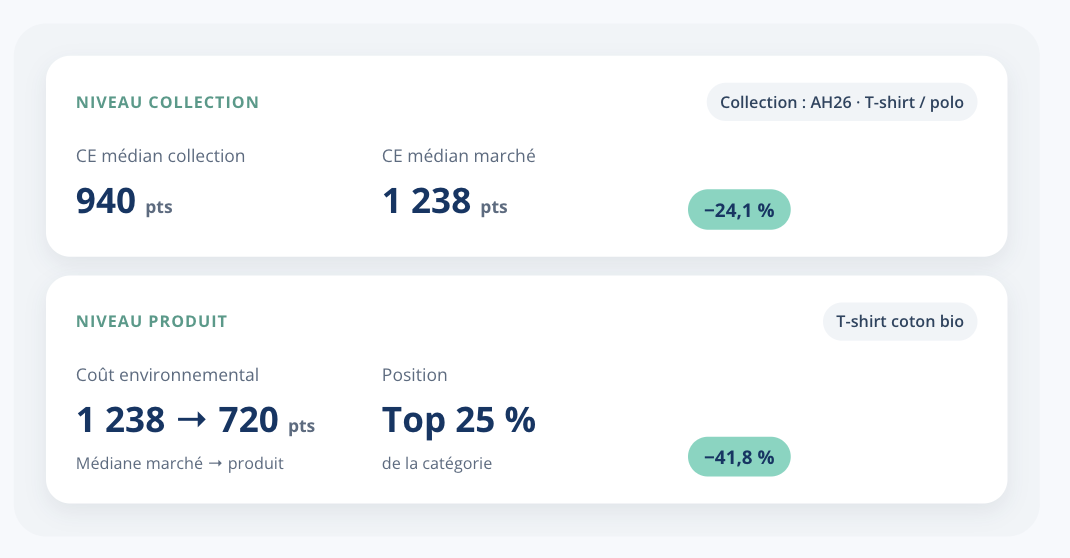
Compare your scores to those of brands in the same market segment or to those of your direct competitors to turn environmental labeling into a differentiating factor.
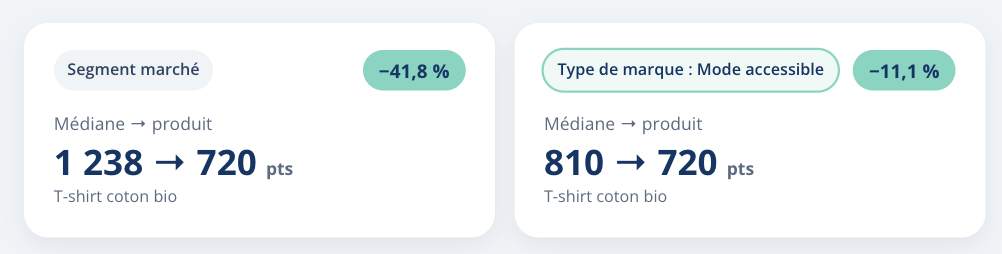
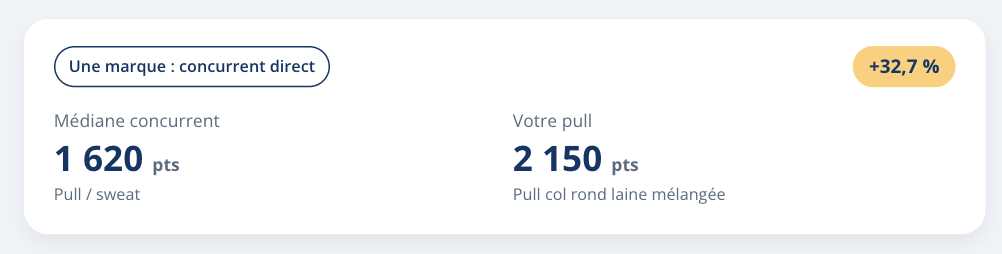
Three comparison frameworks allow you to refine your analyses in the benchmark: your market segment, a brand type, or a specific brand.
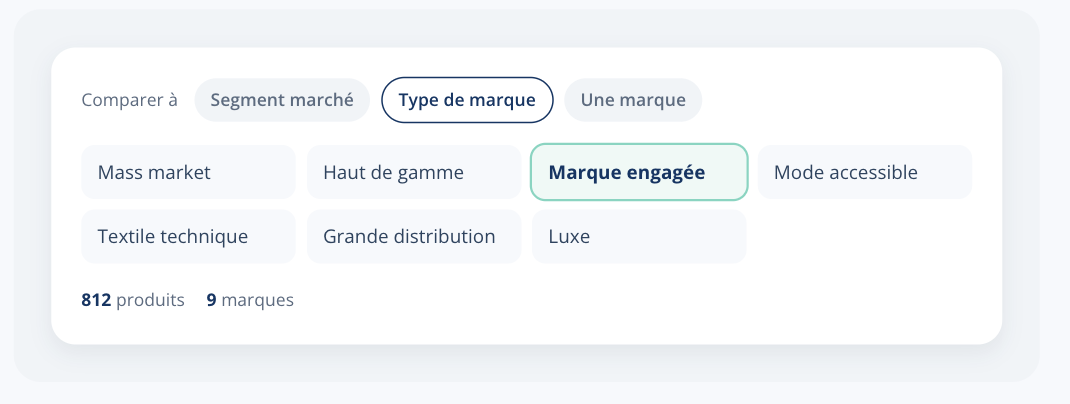
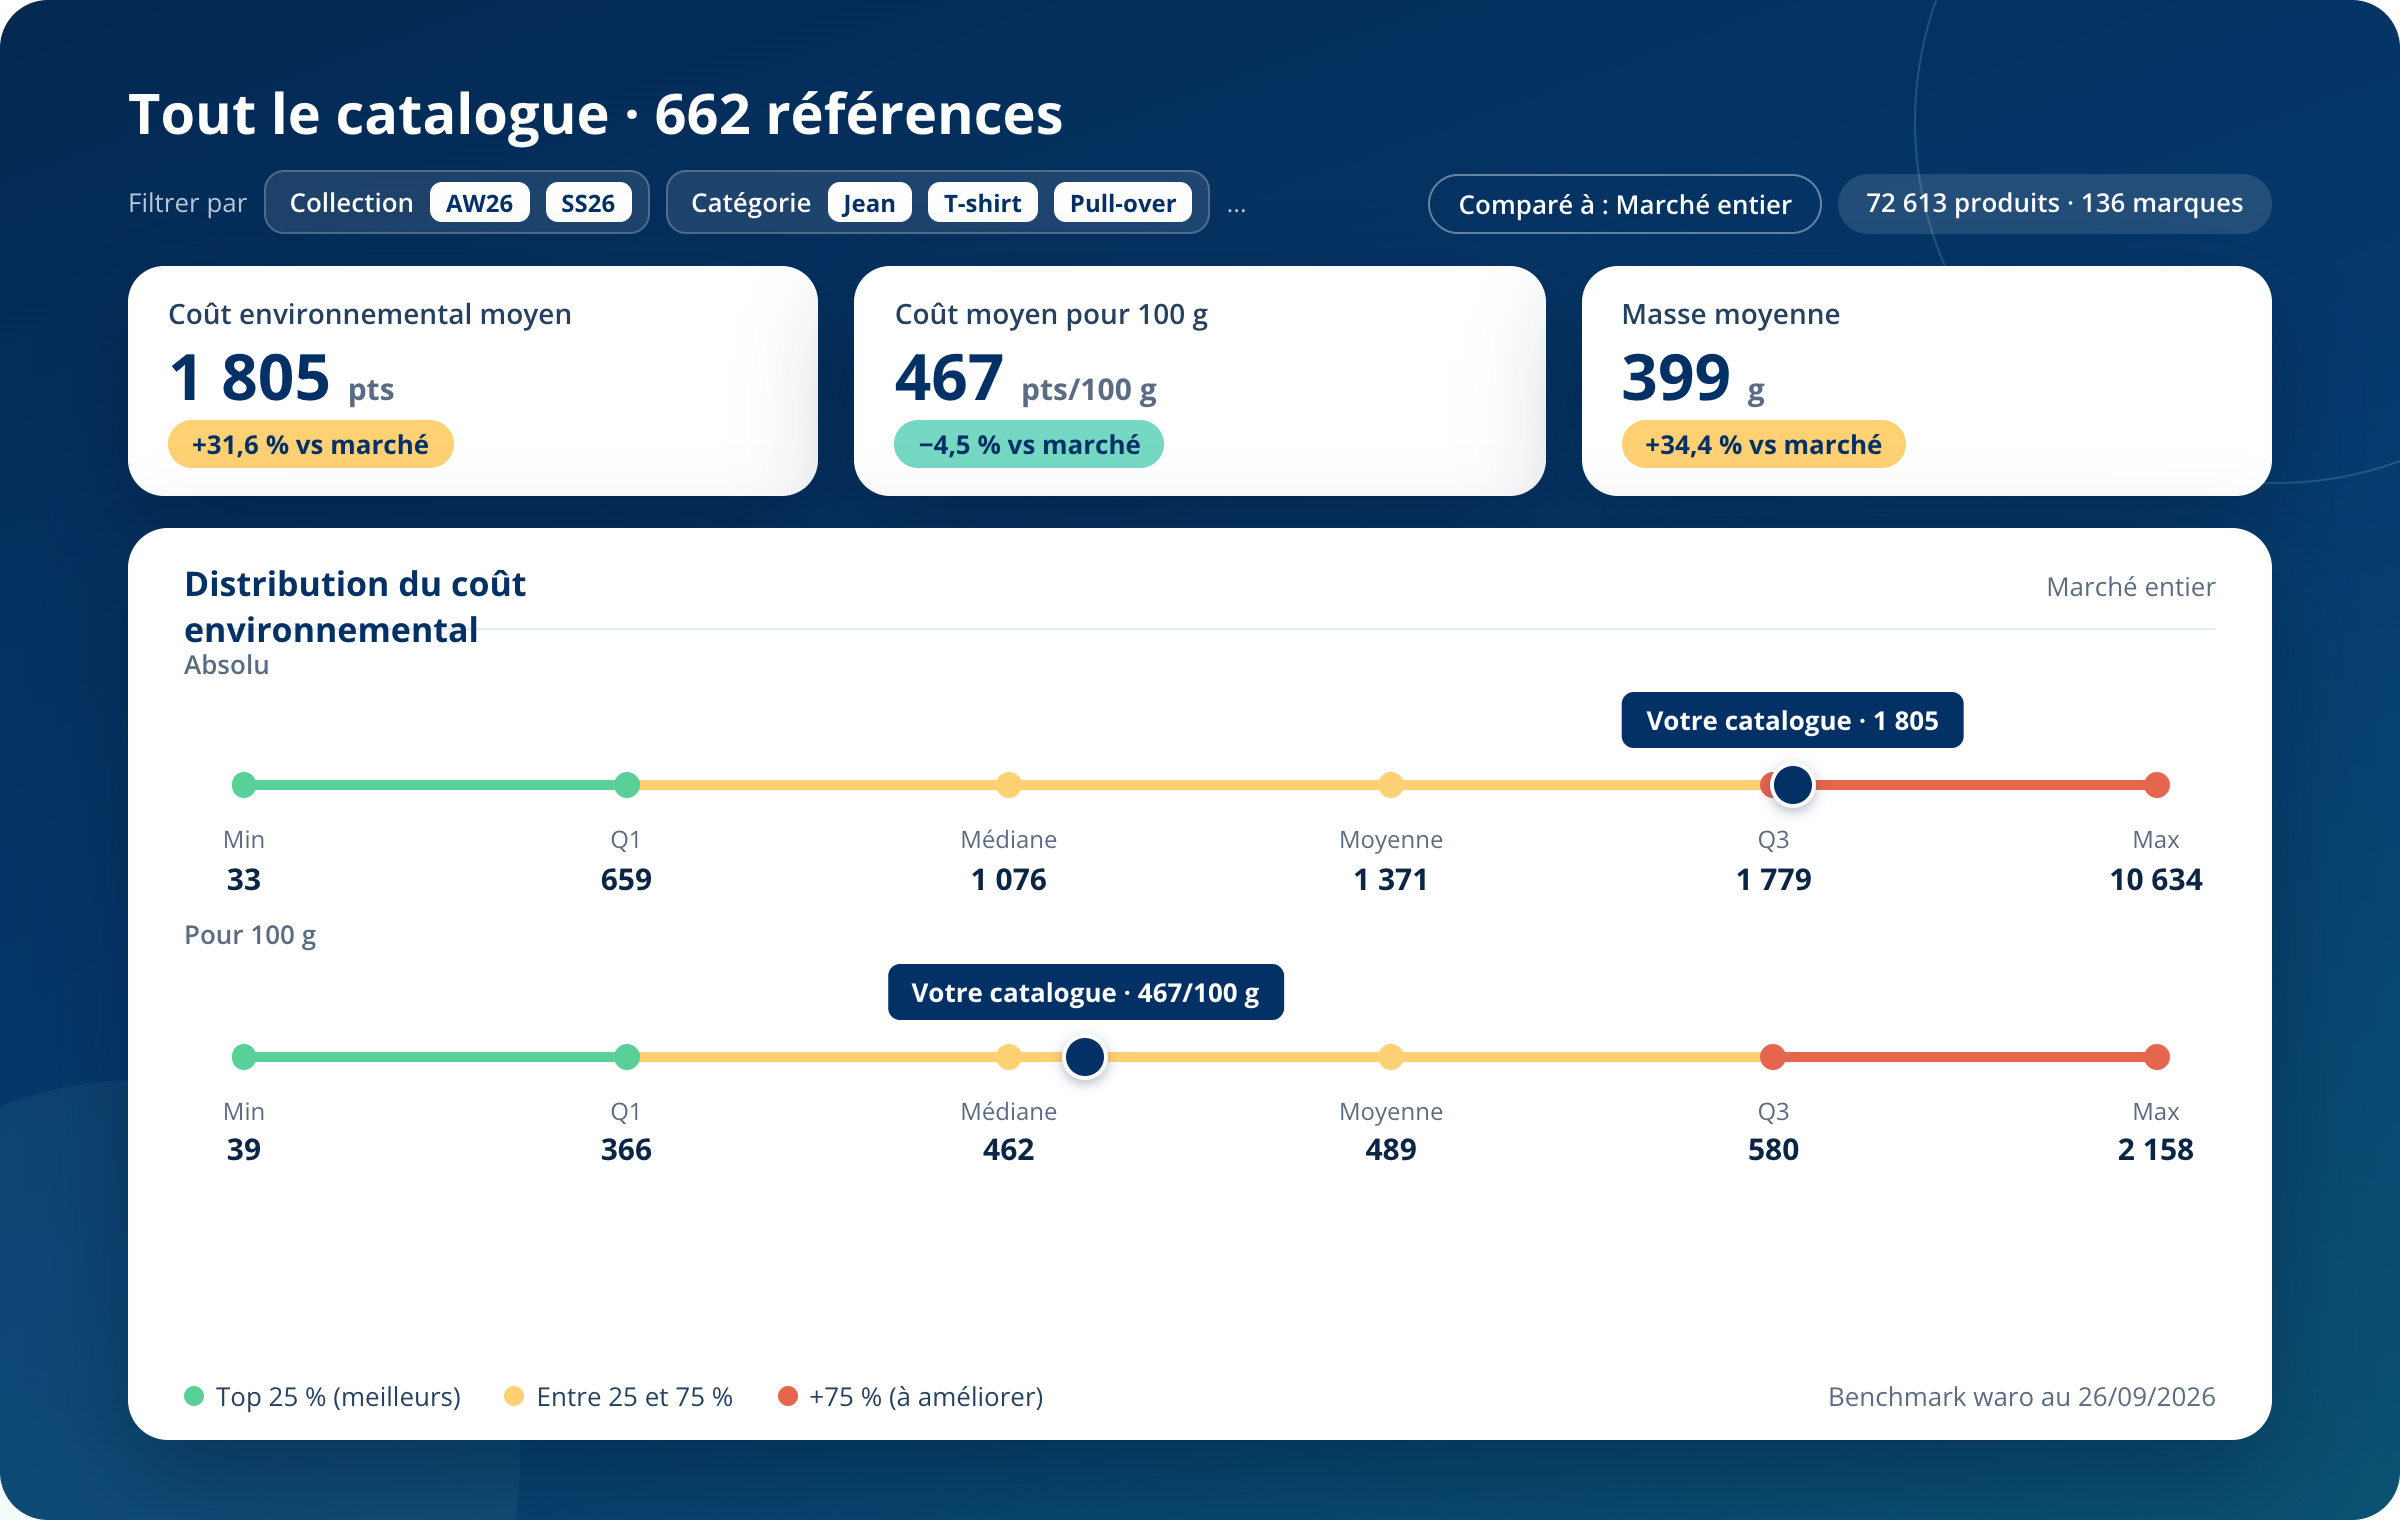
Beyond product-level analyses, the benchmark module provides an overview of how your collections stack up against the market (across all your products, a specific product category, or a specific collection).
This gives you an objective basis for setting quantifiable goals for your teams and determining your priorities for upcoming collections.
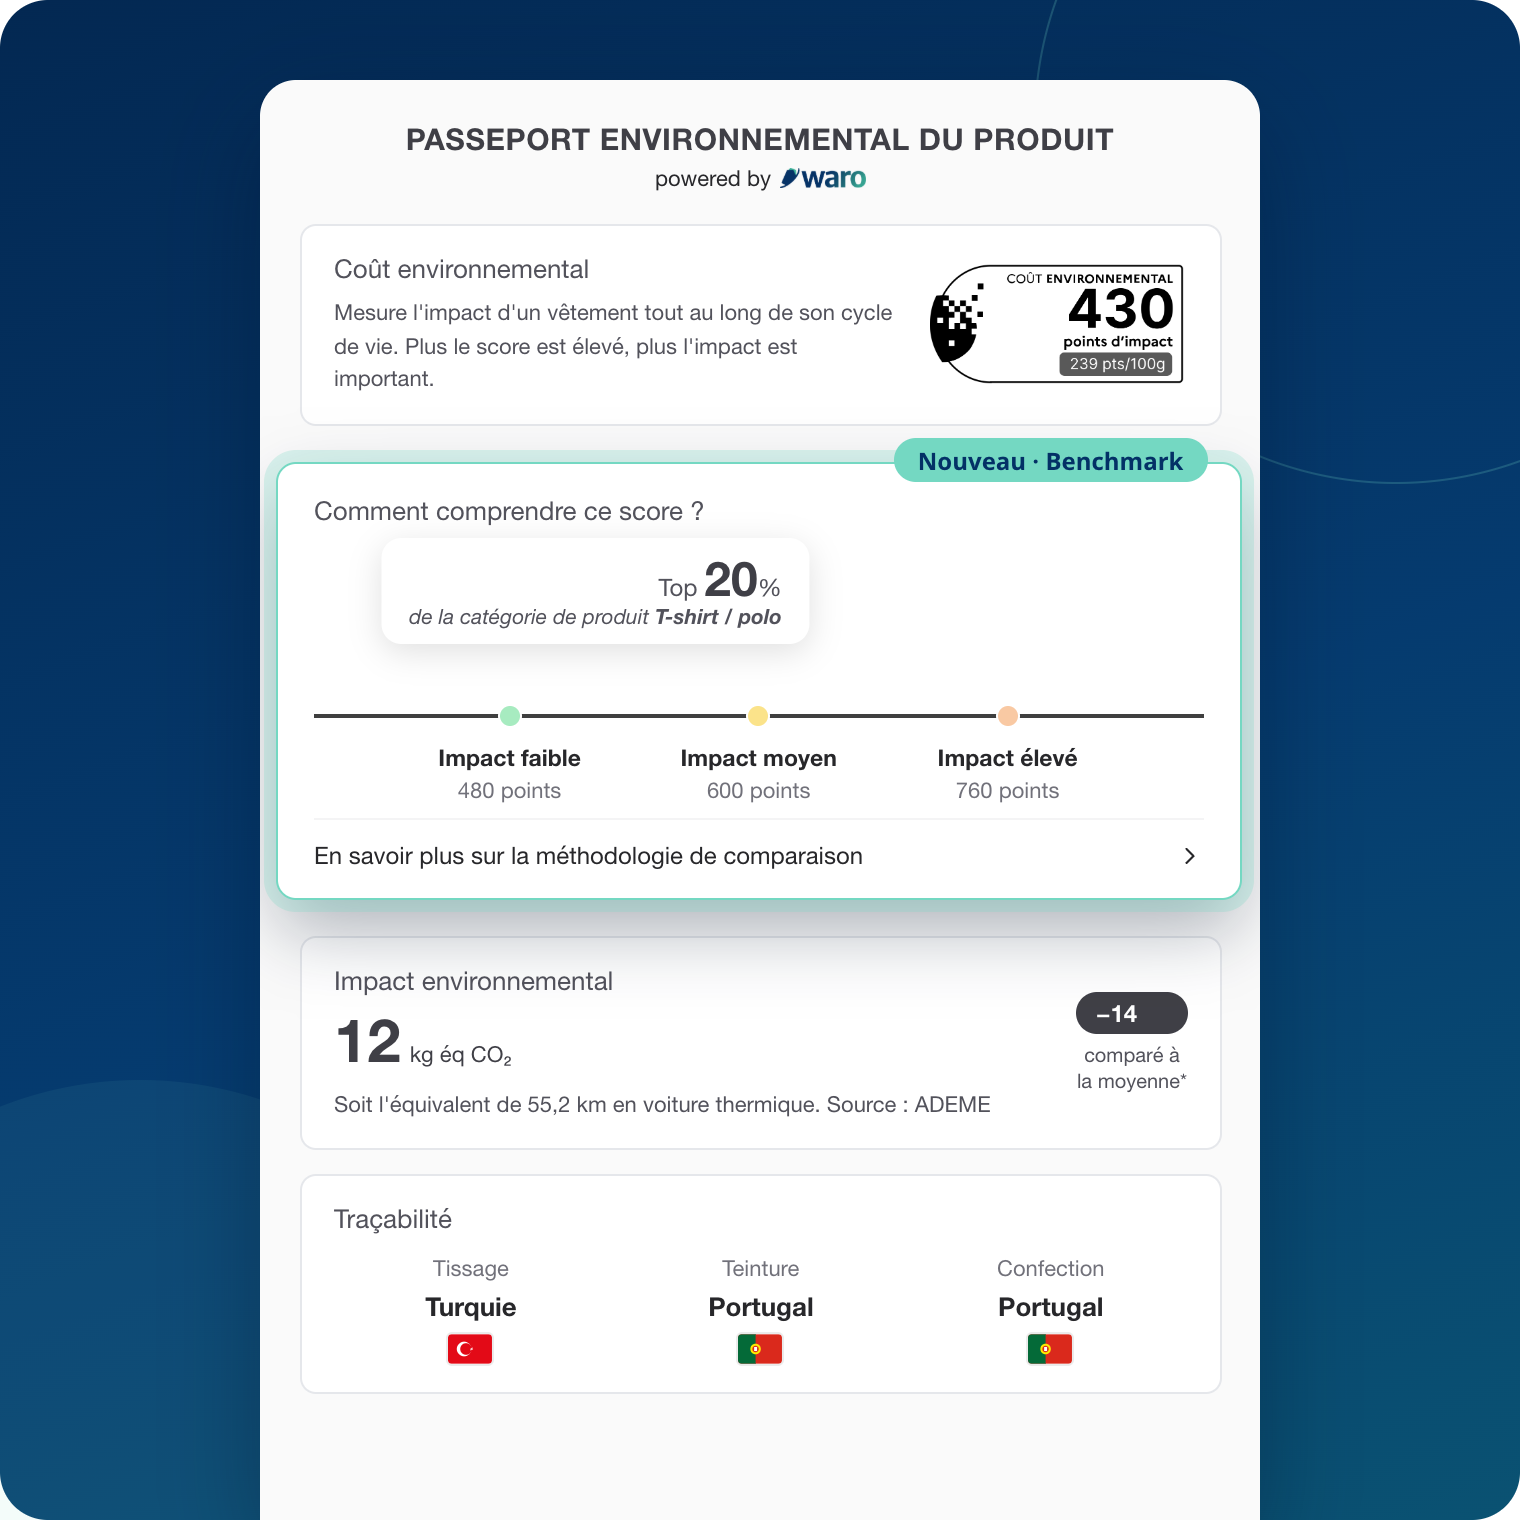
An environmental cost on its own can be difficult for consumers to interpret. The benchmark can also inform your environmental communication to make it more educational.
The WARO product passport can now display a box titled “How to Understand This Score,” which places the product within its category—both in-store via the QR code on the label and online on the product page.
A fashion brand is preparing its next collection and wants to analyze the scores for two of its best-sellers: an organic cotton T-shirt (720 pts) and a blended-wool sweater (2,150 pts).
It can compare them to three benchmarks: the market, products from brands with the same positioning, and one or more direct competitors.
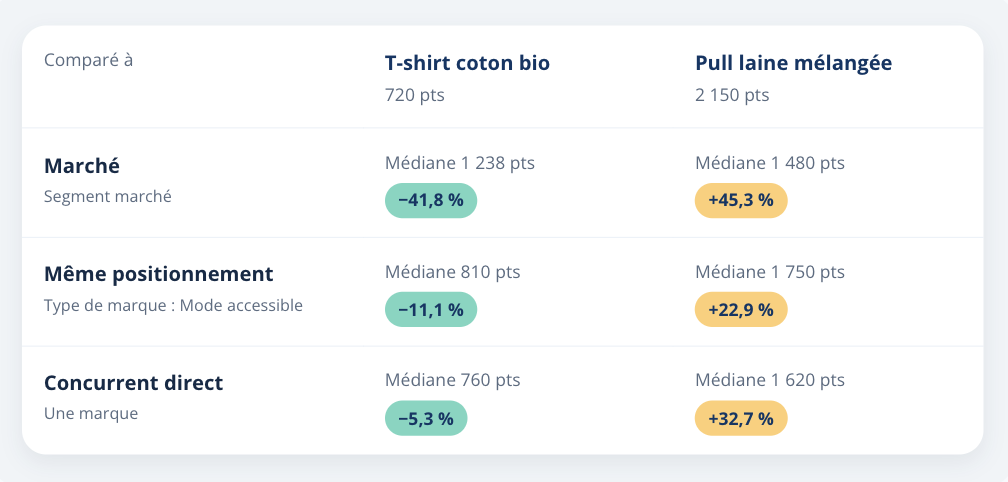
Three possible outcomes:


.png)
.png)
.png)
