Which type of cotton should you choose to reduce the carbon footprint of your products?

Éléonore Huon-Merceur
September 29, 2026

.png)
.jpg)
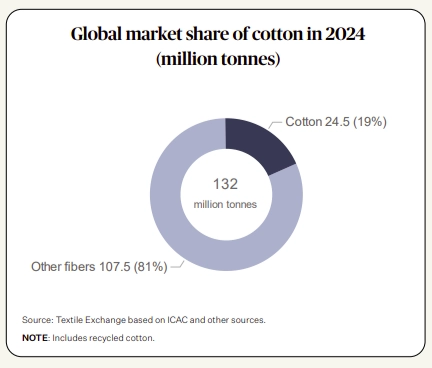
Cotton remains a major agricultural commodity: global production was estimated at approximately 26 million metric tons in 2024, with an annual value of more than $75 billion (source: FAO, World Cotton Day). The top three producers areIndia, China, and the United States, followed by Brazil, which is also one of the world’s largest exporters alongside the United States (source: FAO; consistent ranking across multiple USDA/Statista reports).
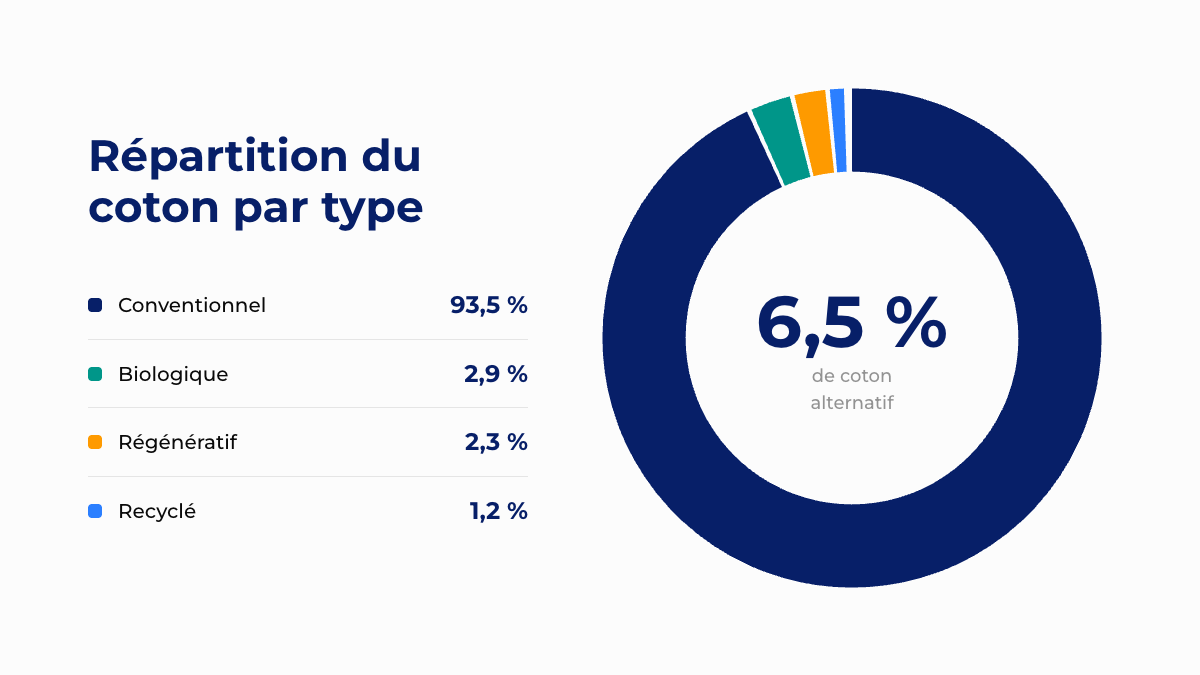
Of this total, the vast majority is still conventional cotton: approximately 93.5%, or nearly 23 million metric tons, including cotton certified by programs such as Better Cotton, CmiA, or REEL, which are “more sustainable” approaches but are neither organic nor regenerative in the strict sense. Organic cotton accounts for approximately 706,000 metric tons (2.9% of the global market), regenerative cotton accounts for approximately 554,000 metric tons (2.3%, after accounting for the approximately 40% overlap between Regenagri—the main dedicated program—and other certifications such as organic), and recycled cotton accounts for approximately 300,000 metric tons (1.2%) (source: Textile Exchange, Materials Market Report 2025).
There is a widespread misconception: that natural fibers are inherently more sustainable, and that “chemical-free” farming must necessarily result in low emissions. The reality is more nuanced—and, above all, much more local than one might imagine.
Take conventional Indian cotton: at 4.17 kg CO₂ eq per kilogram of fiber, it has more than three times the carbon footprint of its Turkish counterpart (1.29 kg). The reason is not the climate or the type of cotton grown—it’s nitrogen. In India, the soil receives an excess of mineral fertilizer far exceeding what the plant can absorb; some of the surplus is converted into nitrous oxide, a gas that is about 270 times more potent than CO₂. In Brazil, it is not nitrogen that dominates the climate impact but land-use change (the conversion of land—often forest or pasture—into cropland), linked to the recent agricultural history of the growing regions. Two countries, two completely different “hotspots,” for the same conventional cotton fiber.
Furthermore, carbon is just one indicator among many: cotton remains a pesticide- and water-intensive crop worldwide, with impacts on biodiversity and soil that the climate change indicator alone does not capture.
Organic cotton eliminates synthetic fertilizers and pesticides in favor of crop rotations and organic fertilization. Eliminating mineral fertilizers often significantly reduces the climate impact compared to conventional farming: -65% in India (from 4.17 to 1.46 kg), -82% in Brazil (from 2.46 to 0.44 kg).
Regenerative cotton is not defined by the exclusion of chemical inputs, as in organic farming, but rather by a set of practices aimed at nourishing the soil: permanent plant cover, long crop rotations, and reduced tillage. Some regenerative systems remain “integrated” and continue to use synthetic fertilizers or pesticides, while others align with organic principles (sometimes referred to as “regenerative organic”).
Textile Exchange also notes that it was unable to distinguish between these two categories in its results: the published figures therefore combine integrated and organic-aligned systems into a single “regenerative” category, without distinguishing between their use of pesticides.
In terms of carbon footprint, this does not automatically translate into an advantage over organic farming: in Turkey, regenerative farming (0.89 kg) performs better than organic farming (0.95 kg), but in India the opposite is true—regenerative farming (1.72 kg) lags behind organic farming (1.46 kg). Carbon sequestration in the soil is a real mechanism, but it does not systematically offset the use of inputs that are still present in some regenerative systems.
Recycled cotton, produced from waste yarn, fabric, or end-of-life clothing that has been mechanically processed back into fiber, has a significantly lower environmental impact than virgin cotton: ranging from 0.44 kg CO₂ eq/kg for post-industrial waste (yarn) to 1.14 kg for post-consumer waste transported internationally, compared to 1.29 to 4.17 kg for conventional cotton (Textile Exchange × Sphera, March 2026). In all cases, electricity used in the recycling process accounts for the largest portion of the environmental impact (85 to 88% of the total), far ahead of transportation (10 to 14%). The electricity mix of the country where recycling takes place therefore matters just as much, if not more, than the type of waste being recycled: two suppliers of recycled cotton can have very different environmental impacts, even though no one type of waste is inherently better than another.
However, this carbon reduction is subject to a maximum incorporation threshold: re-spinning shortens the fibers, which weakens the yarn and limits the durability of the finished product. A T-shirt made from 100% recycled cotton would not hold up over time; in practice, based on feedback from brands, the incorporation of recycled cotton in a product is generally capped at around 5%, with the remainder being virgin cotton to preserve the fabric’s mechanical strength. This threshold varies by supplier and requires case-by-case quality testing before the product is incorporated into a collection.
There is therefore no such thing as an “ideal” cotton in absolute terms: the country of origin, the supplier, and the volume procured are just as important as the type of cotton chosen. A credible material strategy is built on your own sourcing data, allowing you to focus your eco-design efforts where they will have the greatest impact on your carbon footprint.
Are you working on the composition of your collections or product lines and want to quantify the benefits of switching materials? Find out how WARO can help you →


.png)
.png)
.png)
